Educational Leadership Preparation in New York State: A Landscape Analysis
Table of Contents
- Methodology
- Findings: The Landscape of Leadership Preparation
- Findings: Program Structure, Content, and Delivery
- Findings: Diversity, Equity, and Inclusion Preparation
- Discussion
- Implications and Recommendations
- References and Appendices
Introduction
This report provides a landscape analysis of the New York State university-based educational leadership preparation programs. This analysis is limited to programs that primarily lead to school building licensure and does not include programs leading to school district leadership or are primarily doctoral programs with a certification option.
There are many reasons for doing a landscape analysis of New York state programs, particularly given policy shifts affecting leadership preparation programs nationally. Across the United States, the field of educational leadership preparation programs has been rapidly changing, with the addition of new programs and the closing of old programs (Perrone & Tucker, 2019). There is likely a heightened sense of competition and cost differences that may be impacting content and delivery for programs to remain viable (Baum & Steele, 2018). Programs have also shifted their organization with the advent of online and hybrid formats, accelerated by the COVID pandemic.
Program content and delivery are shaped in part by state requirements for licensure (Koonce, 2009; Pavlakis & Kelley, 2016). All states have adopted standards for leadership preparation, and most have internship requirements (Scott, 2018). In 2018, the National Policy Board for Educational Administration adopted a revision of the national standards for educational leadership (the Professional Standards for Educational Leaders) and its preparation (National Educational Leadership Preparation Program Recognition Standards). These revised standards incorporated a stronger focus on diversity and equity, support for all students, and school improvement. Such a shift was expected to influence preparation program content and delivery.
In recent years, nationally, there has been an increased effort to diversify the leadership pipeline, beginning with the preparation and support of aspiring leaders of color (Reyes-Guerra et al., 2022). In addition, there are many challenges (Fuller & Young, 2022) and some innovative approaches (Steele et al., 2021) to leadership preparation. But it remains unclear how prevalent these challenges and innovations might be among programs, particularly in New York state.
Beginning in 2018, NYS has taken great strides to strengthen schools and districts' diversity, inclusion, and equity policies and practices through its Culturally Responsive-Sustaining Education Framework (CR-SE). The CR-SE is grounded in four principles of "1) Welcoming and Affirming Environment; 2) High Expectations and Rigorous Instruction; and 3) Inclusive Curriculum and Assessment; and 4) Ongoing Professional Learning." As further stated, CR-SE promotes Diversity, Equity and Inclusion (DEI) values such as diversity, inclusive learning, and work to eliminate institutional racism and cultural bias. These DEI values apply to diversity and inclusion for racial/ethnic minorities, English learners, and all students based on gender, disability, and sexual orientation. State officials provided implementation guidelines to encourage local and school districts to implement this framework, but these lacked specific guidance for leadership preparation programs.
Given these trends and policy priorities, we, as representative faculty of leadership preparation programs, were interested in learning more about how New York state leadership preparation programs address the state's DEI priorities and their approach to leadership preparation generally. We began by exploring the landscape of preparation programs and their program delivery to answer the following questions:
- What is the landscape of leadership preparation programs throughout New York State? How does program availability differ by region and public/private status?
- What is the nature of program structure, content, and delivery, and how does this differ by region?
- How do programs prepare leaders for diversity, equity, and inclusion practices, and how do these approaches differ by region?
This research is made possible through the Diversity Leadership Initiative, supported by a grant from the New York State Education Department (NYSED) to Stony Brook University. The initiative's aim has been to address the shortage of diverse and well-prepared K-12 school leaders throughout New York State. Facilitated by faculty from five universities, namely Stony Brook University, City College of New York, Fordham University, Hofstra University, and St. John's University, this initiative is a collaborative effort to promote a diverse leadership pipeline. This leadership preparation program investigation provides a foundation for exploring further initiatives.
Methodology
Conducting the landscape study required two steps—identifying all New York state-approved and functioning leadership preparation programs and collecting data about their program structure, content, and delivery, including their focus on leadership and diversity, equity, and inclusion, and number of graduates.
Identifying Programs
The first step involved identifying all the current School Building Leader (SBL) programs across New York State. Data collection for this project occurred in two parts. First, we accessed the New York State Education Department (NYSED) "Inventory of Registered Programs" page, which listed 50 state-registered school leadership programs.
Second, for each identified program, we looked up its respective university and department website from August 2023 to June 2024 to confirm its status. In this review, we determined which programs were still in operation and which had been closed. A key outcome of this inventory was confirming that there were 37 currently active programs in New York State.
To understand the geographic spread of programs, we sorted and classified the leadership programs by region, as designated by New York State programs. In all, there were 37 programs, as shown in Table 1 by region; see Appendix A for the list of active programs.
| Region | Frequency | Percent |
|---|---|---|
| Long Island | 6 | 16% |
| NYC | 11 | 30% |
| Central NY | 4 | 11% |
| Lower Hudson Valley | 3 | 8% |
| Upstate | 4 | 11% |
| Western | 9 | 24% |
| Total | 37 | 100.0 |
Collecting Program Information
We collected program information for these 37 programs in three ways: website analysis, program features survey, and IPEDS data extraction.
Website Analysis
From their websites, we gathered the following information: geographic location, presence of SBL and SBL/SDL programs, contact information, and the program's URL address. This information was compiled into a spreadsheet and converted into a statewide program directory.
Program Features Survey
Design. Two project members drafted an initial survey, which the whole project team and the NYS Chancellor reviewed and provided feedback. New York State's CR-SE framework, the Professional Standards for Educational Leaders (PSELs), and Rabb, Generett, Good & Theoharis's (2021) book Five Practices for Equity-Focused School Leadership guided the development of survey items. To test the quality of the survey, we conducted face validity with three educational leadership professors whose programs represented three different regions from across New York State. Additionally, we had key State-level educational leaders review the survey. We integrated feedback from these key stakeholders. The final survey was designed to collect the following information for each program: geographic location, presence of SBL and SBL/SDL programs, number of credits required, modality of offerings, program costs, faculty attributes, student demographics, and a commitment to diversity, equity and inclusion (DEI) programming.
Fielding. The survey was fielded in Spring 2024 by emailing the program directors of the 37 active programs, with five follow-up requests. Once we hit a 75%-response rate, we turned to contacting program directors directly from the nonresponding institutions and interviewed them to complete the survey for them.
In all, we were able to achieve a 97% response rate, with one program not responding. Additionally, we removed one program because the coordinator shared that their SBL program was embedded within a doctoral program and they did not provide information on their institution's free-standing SBL program. For this study, we are only looking at dedicated school building leadership preparation programs and excluding those that were embedded in doctoral programs. Thus, we had only 35 programs with usable survey responses.
Extracting IPEDS Data
To document program outcomes, we developed a dataset on the number of graduates using the Integrated Postsecondary Education Data System (IPEDS) for the 2023–2024 academic year. We searched for the outcome measures—Postgraduate Certificate and Master's—for all 37 colleges and universities in New York State offering educational leadership programs.
IPEDS classifies program outcomes using multiple taxonomies. Of the 14 available taxonomic categories, we included only those directly related to the principalship; programs focused on the superintendency were excluded. Most institutions report principal certification graduates under "Educational Leadership and Administration, General," while a few use "Instructional and Curriculum Supervision." One institution uses "Elementary and Middle School Administration/Principalship." We combined the data for Educational Leadership and Administration, General and Instructional, and Curriculum Supervision to produce the final dataset. This dataset was uploaded to SPSS and merged with our existing survey and website data for analysis. The publicly available IPEDS data results by institution are included as Appendix B.
Analysis
We combined the website, survey data and IPEDS data into one data set. Where there were inconsistencies, we relied upon the program director survey feedback to be the most up-to-date. The data were then analyzed using SPSS to generate descriptive statistics and crosstabulations of program features and delivery by region of the state and public or private status, testing statistical differences where relevant.
We learned in our analysis that some institutions have several programs or offer the same program through different modalities. As we gathered survey data from one program director for each institution, we are assuming that the responses reflect all versions of the programs for institutions with more than one program.
Findings: The Landscape of Leadership Preparation in New York State
Our first question was intended to capture the landscape of leadership preparation programs in New York State. We counted programs by institution, as several institutions have multiple programs. Based on our analysis, we determined that, currently, there are 37 institutions with leadership preparation programs across New York state leading to School Building Leadership certification. These programs are listed in Appendix A.
Program Changes
In recent years, 26% (13 of 50 on the NYSED list) of the institutions had educational leadership programs that closed across the state. Three institutions closed: Concordia, College of New Rochelle, and College of St. Rose, and ten institutions discontinued or put their SBL certification programs on hiatus. In terms of sector affiliation, 92% of closed institutions are private. No public institutions closed. The only public program to close was at Baruch, CUNY. Most closed programs (69%) were in the New York metropolitan area.
Closed Programs in New York State
State-registered institutions no longer offering certificate programs:
- CUNY Baruch College
- Iona University
- Manhattan University
- New York Institute of Technology
- New York University
- Pace University
- Relay Graduate School of Education
- Utica University
- University of Rochester
- Yeshiva University
Closed Institutions:
- Concordia College
- College of New Rochelle
- College of St. Rose
Regional Distribution
As our regional analysis shows, the programs are unevenly distributed across New York. Over half (54%) of the programs are located in the New York metropolitan area (NYC, Long Island and the lower Hudson Valley), with the most programs in New York City (30%), see Figure 1. Outside of New York City, Western New York has the most programs at 24%, followed by Long Island (16%), Central (11%), and Upstate (11%) New York. The Lower Hudson Valley (8%) has the fewest programs.
Figure 1: Dispersion of 37 Active Educational Leadership Preparation Programs by New York Region
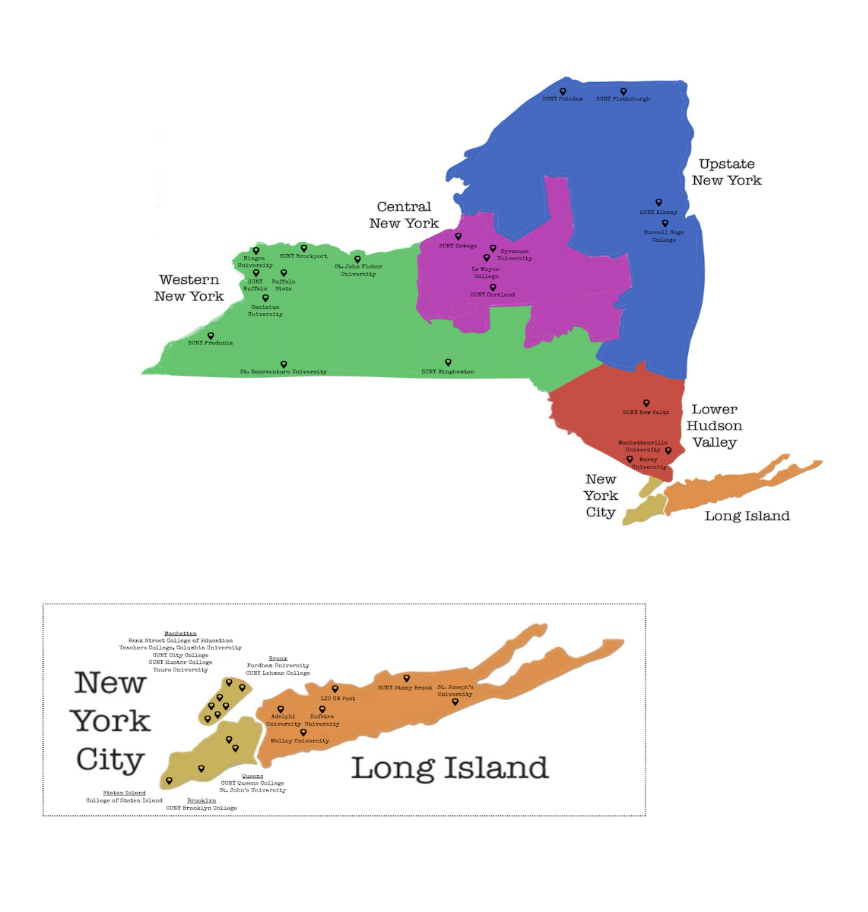
For a complete list of institutions by region, see the New York State Educational Leadership Program Directory or Appendix A.
Institution Type
The majority of programs, 51%, are offered by private institutions. Forty-nine percent of these programs are run by public institutions, either the State University of New York (SUNY) or the City University of New York (CUNY).
The distribution of types of certificate programs varies across regions. In the Lower Hudson Valley, no institution offers an SBL-only certificate program. In Upstate New York, 75% of the institutions have SBL-only certificate programs. Conversely, all institutions in the Lower Hudson Valley prepare graduates for both SBL and SDL certification. Similarly, 75% of programs in Western New York and 70% of New York City institutions prepare graduates for both SBL and SDL certification within one program. Only 25% of institutions in Upstate New York offer SBL and SDL certification preparation within one program, making it more challenging to obtain SDL certification in Upstate New York.
| Program Characteristic | Long Island | NYC | Central NY | Lower Hudson Valley | Upstate | Western | Total |
|---|---|---|---|---|---|---|---|
| Public or Private | |||||||
| Public | 16.7% | 60.0% | 50.0% | 33.3% | 75.0% | 50.0% | 48.6% |
| Private | 83.3 | 40.0 | 50.0 | 66.7 | 25.0 | 50.0 | 51.4 |
| SBL or SBL/SDL | |||||||
| SBL | 50.0 | 30.0 | 50.0 | 0 | 75.0 | 25.0 | 37.1 |
| SBL and SDL | 50.0 | 70.0 | 50.0 | 100.0 | 25.0 | 75.0 | 62.9 |
| Program Type | |||||||
| Masters only | — | 50.0 | — | — | — | 12.5 | 17.1 |
| Certificate only | 66.7 | 10.0 | 100.0 | — | 75.0 | 25.0 | 40.0 |
| Masters and certificate | 33.3 | 40.0 | — | 100.0 | 25.0 | 62.5 | 42.9 |
| Program Modality | |||||||
| Hybrid | 16.7 | 50.0 | 25.0 | — | 25.0 | — | 21.2 |
| Asynchronous only | — | 25.0 | — | — | 25.0 | 37.5 | 18.2 |
| Synchronous and asynchronous | 66.7 | — | 50.0 | — | 25.0 | 50.0 | 33.3 |
| Multiple modalities | 16.7 | 25.0 | 25.0 | 100.0 | 25.0 | 12.5 | 27.3 |
| Total | |||||||
| Total | 100 | 100 | 100 | 100 | 100 | 100 | 100 |
The distribution of types of educational credential options varies by region. In Central New York, 100% of the institutions' programs lead to a post-graduate certificate only. These institutions do not offer a master's degree option. Similarly, in Upstate New York (75%) and Long Island (67%), the majority of the institutions' programs lead solely to a post-graduate certificate. In contrast, 50% of the institutions' programs offered in New York City lead to a master's degree only, 10% are certificate only, and the other 40% have programs leading to both a master's degree or a post-graduate certificate. All the programs in the Lower Hudson Valley lead to both a master's degree or a certificate.
Private institutions are more likely than public institutions to offer both educational credential options (56% vs. 31%), while public institutions are more likely to offer only a credential option.
Number of Graduates
The institutions' programs varied widely in the number of graduates earning either a post-graduate certificate or a master's degree. This ranges from a low of 0 to a high of 165 graduates in 2024, based on IPEDS reporting data. Table 3 shows the average number of program graduates by region and the total number of graduates by region in 2024.
| Region | Average number per program | Sum among programs | ||||
|---|---|---|---|---|---|---|
| Post-grad certificate | Master's | Total graduates | Post-grad certificate | Master's | Total graduates | |
| Long Island | 60 | 7 | 67 | 359 | 42 | 401 |
| NYC | 8 | 30 | 38 | 76 | 270 | 346 |
| Central NY | 32 | 6 | 38 | 126 | 25 | 151 |
| Lower Hudson Valley | 24 | 7 | 32 | 57 | 0 | 57 |
| Upstate | 13 | 2 | 15 | 39 | 6 | 45 |
| Western | 9 | 6 | 15 | 60 | 42 | 102 |
| Total | 23 | 13 | 36 | 733 | 407 | 1140 |
The average number of graduates by institution is smallest in Upstate New York and Western New York (15 graduates) and largest on Long Island (67 graduates). The state averages 13 master's graduates and 23 postgraduate certificate graduates by program.
According to the IPEDS data, there were 1,140 educational leadership graduates statewide in 2024, 36% of whom earned a master's and 64% earned a postgraduate certificate. The total number of graduates varied widely by region, with 35% from Long Island institutions' programs. The smallest number are graduates of programs in institutions in the Lower Hudson Valley and Upstate New York. These figures represent the location of the institution of the leadership preparation program and not the graduates, however. Several institutions have programs that are online and serve aspiring leaders from around the state. Other programs have partnerships with districts in other parts of the state, as well, which may skew how graduates are counted by region.
The number of graduates was also analyzed by type of institution, as shown in Table 4. Private institutions average significantly more graduates per program than do public institutions (41 and 31 per program, respectively). Combined, 56% of all graduates earned their degree or certificate from a private institution, half of whom earned a master's degree.
| Institution Type | Average number | Sum among programs | ||||
|---|---|---|---|---|---|---|
| Post-grad certificate | Master's | All graduates | Post-grad certificate | Master's | All graduates | |
| Public | 26 | 5 | 31 | 412 | 80 | 492 |
| Private | 20 | 20 | 41 | 321 | 327 | 648 |
| Total | 23 | 13 | 36 | 733 | 407 | 1140 |
Findings: Program Structure, Content, and Delivery
To address our second question, we identified the nature of program delivery and analyzed regional and institutional type differences. The program delivery attributes included: certificate options, program options, number of credits and instructional modality. As part of program delivery, we examined two program inputs—tuition costs and the nature of the faculty (as either full-time faculty or adjunct). Below, is the landscape of the program delivery statewide and as compared regionally and by institution type.
Certificate Options
According to our survey results, the majority of institutions offer a combined SBL/SDL program (63%). Thirty-seven percent offer only an SBL certificate program.
The distribution of types of certificate programs varies across regions (see Table 2). In the Lower Hudson Valley, no institution offers an SBL-only certificate program. In Upstate New York, 75% of the institutions have SBL-only certificate programs. Conversely, all institutions in the Lower Hudson Valley prepare graduates for both SBL and SDL certification. Similarly, 75% of programs in Western New York and 70% of New York City institutions prepare graduates for both SBL and SDL certification within one program. Only 25% of institutions in Upstate New York offer SBL and SDL certification preparation within one program, making it more challenging to obtain SDL certification in Upstate New York.
Private institutions are more likely than public institutions to offer the combined SBL and SDL certification program (63% vs. 56%) and are less likely to prepare graduates only for the SBL (see Table 5).
| Program Attributes | Public | Private | Total |
|---|---|---|---|
| Certification Focus | |||
| SBL | 43.8% | 37.5% | 40.6% |
| SBL and SDL | 56.3 | 62.5 | 59.4 |
| Program Type | |||
| Masters only | 12.5 | 12.5 | 12.5 |
| Certificate only | 56.3 | 31.3 | 43.8 |
| Master's and certificate | 31.3 | 56.3 | 43.7 |
| Modality | |||
| Hybrid | 20.0 | 20.0 | 20.0 |
| Asynchronous only | 13.3 | 20.0 | 16.7 |
| Synchronous and asynchronous | 26.7 | 40.0 | 33.3 |
| Multiple modalities | 40.0 | 20.0 | 30.0 |
| Total | 100.0 | 100.0 | 100.0 |
Educational Credential Option
The various institutions offer two types of graduate credential options: a master's degree, a post-graduate certificate or both options.
The distribution of types of educational credential options varies by region (see Table 2). In Central New York, 100% of the institutions' programs lead to a post-graduate certificate only. These institutions do not offer a master's degree option. Similarly, in Upstate New York (75%) and Long Island (67%), the majority of the institutions' programs lead solely to a post-graduate certificate. In contrast, 50% of the institutions' programs offered in New York City lead to a master's degree only, 10% are certificate only, and the other 40% have programs leading to both a master's degree or a post-graduate certificate. All the programs in the Lower Hudson Valley lead to both a master's degree or a certificate.
Private institutions are more likely than public institutions to offer both educational credential options (56% vs. 31%), while public institutions are more likely to offer only a credential option (see Table 5).
Number of Credits
The institutions' programs averaged about 31 required credits in length, but ranged widely from 22 to 36 credits (see Table 6). This average and range masks wide variations among the programs: Five programs require 22-26 credits, while 7 programs require 35-36 credits. This variability was unrelated to whether the preparation programs are only for School Building Leader (SBL) preparation or a combination of school and district leader preparation (SBL/SDL).
The average number of required credits varied somewhat by region and institution type. The range was from a low average of 29 credits for Long Island institutions' programs to almost 33 credits for Upstate New York institutions' programs (see Table 6).
There was a statistically significant difference between public and private institutions in the number of required program credits, with public institutions requiring more credits on average than private institutions (32.6 vs 29.2 credits) (see Table 7).
| Program Attribute | Long Island | NYC | Central NY | Lower Hudson Valley | Upstate | Western | Total |
|---|---|---|---|---|---|---|---|
| Number of credits | 29.17 | 31.00 | 30.75 | 31.00 | 32.75 | 30.88 | 30.83 |
| Tuition per credit | $915.75 | $764.78 | $552.50 | $840.33 | $516.91 | $700.56 | $725.21 |
| Total program cost | $26,077.50 | $23,911.89 | $16,930.50 | $26,210.00 | $17,463.73 | $20,625.96 | $22,138.48 |
| Average percentage of students who are (2024) | |||||||
| Female | 67.60 | 78.80 | 71.67 | 65.00 | 65.00 | 71.25 | 72.13 |
| White | 67.80 | 43.50 | 65.00 | 44.00 | 65.00 | 78.38 | 60.61 |
| Urban | 18.33 | 88.80 | 40.00 | 28.33 | 17.50 | 24.38 | 43.09 |
| Staffing | |||||||
| Number of full-time faculty (tenure and clinical) | 1.33 | 4.00 | 2.63 | 3.00 | 4.33 | 1.43 | 2.70 |
| Number of adjuncts | 21.17 | 10.67 | 9.00 | 5.00 | 7.75 | 5.29 | 10.36 |
| Program Attributes | Public | Private | Total |
|---|---|---|---|
| Average number of credits* | 32.59 | 29.17 | 30.83 |
| Average percentage of students (2024) who are: | |||
| Female | 73.00 | 71.31 | 72.13 |
| White | 61.20 | 60.06 | 60.61 |
| Urban | 45.00 | 41.28 | 43.09 |
| Program Cost | |||
| Tuition per credit* | $509.13 | $991.15 | $725.21 |
| Total Program Cost (tuition x credits)* | $16,498.81 | $29,079.62 | $22,138.48 |
| Staffing | |||
| Average number of full-time faculty (tenure and clinical) | 3.14 | 2.36 | 2.70 |
| Average number of adjuncts | 10.50 | 10.24 | 10.36 |
*p<.01
Modality
The institutions delivered their School Building Leadership (SBL) programs through a variety of modalities. None offer only an in-person program, while 21% offer their programs as hybrid only, combining in-person and online experiences (see Table 2). Fifty-one percent offer their programs only online, including 18% that offer only an asynchronous program option, which means they never meet, and 33% offer synchronous and asynchronous. The remaining 27% of programs offer multiple program options with different modalities (e.g., a hybrid program and an online program).
There are some regional differences in where hybrid-only programs (with their in-person components) are offered: The majority of institutions' programs on Long Island and in Western NY are only online, while all the Lower Hudson Valley programs include hybrid options.
Public institutions are more likely to offer multiple modalities (40% vs. 20%) and as likely to offer on the hybrid option (20%) as private institutions (see Table 5).
Program Cost
A key part of program structure and delivery is cost, which we found varied widely among the programs and regions. The average cost of tuition in 2023-24 among the reporting institutions' programs was $725 per course credit, ranging from $430 to $1868.
The per-credit tuition rate varied by region from a high average of $915 per credit on Long Island to a low average of $517 in Upstate New York. These regional differences in part reflect differences between prevalence of public and private institutions, with private institutions' average tuition per credit almost twice that of public institutions ($991 vs. $509) (see Tables 6 and 7).
The average total tuition (credits*tuition) among these programs is $22,238, and ranges widely from a low of $11,280 to a high of $56,040. There were regional differences, with the highest average total tuition found in the Lower Hudson Valley and Long Island and the lowest in Central and Upstate New York. The greatest difference was by institution type, however, with private institutions' average total tuition that is 75% significantly higher than public institutions' ($29,079 vs $16,498).
Faculty and Adjuncts
Staffing leadership preparation programs varied widely among the institutions. The institutions' leadership preparation programs have an average of 2.7 tenure/tenure track and clinical faculty, ranging from 0 to 10. Public institutions have a higher average number of faculty than do private institutions (3.14 vs 2.36 faculty). There are also strong regional differences in the average number of faculty. Institutions' programs on Long Island and in Western New York had few faculty on average (1.33-1.44), while institutions in NYC and Upstate New York averaged almost three times as many faculty members (4.0-4.3).
In contrast, the institutions average 10.4 adjunct faculty teaching in their programs, ranging from 0 to 78. There was no difference between the averages for public and private institutions on the number of adjuncts used (see Table 7). But, this average ranges widely by region, from a low average of 5 adjunct faculty in the Lower Hudson Valley programs to a high average of 21 adjunct faculty per program on Long Island (see Table 6).
Relationship Among Program Attributes
We explored several relationships among program attributes and found some patterns. We correlated the number of credits, tuition per credit, number of faculty and adjuncts, number of graduates, and percentage of students who are female or white. There was no significant relationship among these, with the exception that the number of program graduates is significantly and positively related to the number of program adjuncts and average tuition per credit.
There were discernible differences by modality, however (see Table 8). On average, asynchronous-only programs are somewhat shorter than programs with other modalities, have the lowest average tuition per credit, and have the lowest percentage of students who are female (63%). Online programs (combining synchronous and asynchronous modalities) have the highest average tuition per credit, the highest average number of adjunct faculty, the highest percentage of students who are female, and the largest average number of graduates.
| Modality | Total average graduates | Number of full time faculty | Number of adjuncts | Tuition per credit | Number of credits | % Female | % White* |
|---|---|---|---|---|---|---|---|
| Hybrid | 21.8 | 1.25 | 5.20 | $726.67 | 30.67 | 76.17 | 79.00 |
| Asynchronous only | 27.0 | 3.60 | 4.20 | $632.75 | 28.20 | 63.25 | 70.25 |
| Synchronous and asynchronous | 50.3 | 2.17 | 14.70 | $759.60 | 30.60 | 78.75 | 70.63 |
| Multiple modalities | 23.4 | 3.11 | 5.00 | $643.39 | 32.00 | 66.88 | 47.88 |
| Total | 32.7 | 2.61 | 8.24 | $701.20 | 30.63 | 72.12 | 65.50 |
*p<.05
Findings: Diversity, Equity, and Inclusion Preparation Practices
Of primary interest for our investigation was how programs addressed diversity and social justice in their leadership preparation programs, including whether they had a dedicated course and what content topics were covered in their programs.
Dedicated Course
As shown in Table 9, 32% of the programs have a dedicated DEI or social justice course. There was wide regional variation in this course requirement. Over half the programs in Central, Western and Upstate New York had such a requirement, while none on Long Island did. Private preparation programs were significantly more likely than public programs to have this course requirement (39% vs. 25%). Examples of names of the DEI-focused course titles include: Reading for Equity and Social Justice, Leading for Excellence: Educational Equity, Diversity, and Inclusion, and Culturally Responsive Leadership.
| Region | Dedicated DEI Course (%) | Average extent of DEI Indicators |
|---|---|---|
| Long Island | 0% | 4.3 |
| NYC | 22 | 4.3 |
| Central NY | 50 | 4.5 |
| Lower Hudson Valley | 33 | 4.8 |
| Upstate | 50 | 4.0 |
| Western | 50 | 3.8 |
| Total | 32 | 4.2 |
| Public | 25% | 4.1 |
| Private | 39%* | 4.3 |
*p<.05
Note: Percentages indicate the proportion of programs within each region that have a dedicated DEI course. Curriculum indicators reflect the average number of DEI-related measures integrated into the programs.
Almost all program directors (89%) indicated that DEI was integrated either moderately or extensively across all coursework (See Table 10). In open-ended questions, some program directors shared that in their programs, DEI-focused curricula occur throughout their coursework, rather than being situated in a particular course. For example, one program director explained that DEI-related content was the focus of a special education course, but then, they also "weave [it] intentionally throughout the program and internships." Similarly, another program director hailing from across the State shared that, "We weave DEI research and anti racist leadership practices into each course. We use the text, Five Practices for Equity Focused School Leadership, over several of our beginning courses."
Instructional Content and Learning Activities
We also explored how and the extent to which the institutions' programs included content that developed leadership skills to support diversity, equity and inclusion. Using a 5-point scale (1=not at all true…5=to a great extent), program directors rated the extent to which their programs covered 11 different DEI-related content and experiences for their typical students seeking school building leadership certification. The program directors rated their programs highly in the areas of developing students' capacity to strive for equity (4.9) and developing staff's cultural competence (4.84). In fact, 91% of coordinators said that to a great extent they developed students' capacity to strive for equity. Around 83% of directors reported assessing DEI content either moderately (34%) or to a great extent (49%) (See table 10).
| DEI Content | N | Minimum | Maximum | Mean | Std. Deviation |
|---|---|---|---|---|---|
| Strive for equity | 31 | 4 | 5 | 4.90 | 0.301 |
| Develop culturally relevant, coherent systems of curriculum and instruction | 31 | 4 | 5 | 4.87 | 0.341 |
| Develop professional capacity of staff | 31 | 4 | 5 | 4.84 | 0.374 |
| Support English language learners | 31 | 2 | 5 | 3.68 | 0.945 |
| Support students with disabilities | 31 | 2 | 5 | 4.03 | 0.836 |
| Support LGBTQ+ students | 30 | 2 | 5 | 3.70 | 0.915 |
| Support indigenous students | 31 | 1 | 5 | 3.10 | 1.274 |
| Emphasize continuous improvement | 30 | 3 | 5 | 4.87 | 0.434 |
| Integrates DEI throughout | 31 | 2 | 5 | 4.42 | 0.923 |
| Assess DEI skills | 31 | 2 | 5 | 4.26 | 0.893 |
| Expose students to research by scholars of color | 30 | 1 | 5 | 3.80 | 1.095 |
The 11 experiences were averaged together as an overall rating of program depth, as shown in Table 9, and compared regionally and by institution type. The results show an average of 4.2 (between moderate and great extent) among the 11 indicators, ranging from 2.9 to 5 average of extensiveness of indicator coverage. This average ranged somewhat by region, between a low of 3.8 in Western New York (reflecting "somewhat") to a high of 4.8 in the Lower Hudson Valley. There was little difference in the average number of indicators between public and private institutions.
Some program directors also shared information about the instructional content activities that were employed in their courses to support learning about diversity, equity, and inclusion. The majority of programs incorporate an equity focus in their courses by using DEI-focused case studies (86%) while 57% reported that their programs assigned DEI-focused course texts. Some program directors (51%) reported that some courses focused on racial identity development. These readings and course foci require students to reflect on how their individual backgrounds and experiences shaped their perceptions of education and society. Program directors also rated how much their programs exposed their students to research by scholars of color (3.8)(see Table 10), with only around 30% indicating they did so to a great extent.
In open-ended questions, some program directors identified active learning activities to develop DEI-related leadership skills, including equity audits (46%), simulations (37%), community walks (29%), and DEI-focused portfolio or thesis (23%). One program director described the benefit of this active learning approach referencing, "the power of community walks and projects to engage families and stakeholders." She also shared that action research (another active learning strategy) focused on bringing marginalized and minoritized students into the sphere of success." Following this theme of active learning, another program director described, "In each course in the program, students must engage in a simulation with a trained actor, and many of the simulations are DEI focused." Finally, a few programs included intensive learning experiences. For example, one program director incorporated resources and supports offered by their larger institution, including "Truth, Racial Healing, and Transformation Healing Circles available to the campus." She shared that her program also participated in "social justice teach-ins, annual events on campus, and the National Day of Racial Healing."
Inclusive Practices
Notably, when it came to developing leadership capacity to support individual groups inclusively, the program directors rated their program content much lower, see Table 10. Program directors were asked to rate the extent to which they developed students' capacity to support a variety of student groups, and their average ratings reflect a moderate focus on students with disabilities (4.0 on a 5-point scale), but less so on ELLs and LGBTQ+ students (3.6), and far less on indigenous students (3.0). Moreover, only about a quarter of the program directors thought that their programs developed leadership capacity to support ELLs and SWDs to a great extent, and around a sixth believed they developed students' leadership capacity to support LGBTQ+ and Indigenous students to a great extent. To a slightly more than a moderate extent, program directors reported that they were likely to integrate DEI throughout their program and were able to assess their students' DEI skills.
We also asked program directors to rate the extent to which they developed students' leadership capacity in related areas that would support DEI goals. Program directors had a high average rating reflecting extremely positive responses regarding their emphasis on continuous improvement (4.87) with 91% saying they use these strategies to a great extent. Similarly, 100% of respondents indicated that their programs teach aspiring leaders to develop and support rigorous, culturally relevant, and coherent systems of curriculum, instruction, and assessment with 89% replying with to a great extent. Overall, directors responded positively to general curricular and DEI goals, but less so when addressing leadership capacity to support particular student sub-groups.
Alignment with PSEL Standards and CR-SE Framework
We analyzed the scope of this content in terms of the Professional Standards for Educational Leaders (PSEL) and the NYS Framework for Culturally Responsive and Sustaining Education (CR-SE) Framework (as shown in Table 11). As this standards analysis shows, the program directors rated their programs very high in addressing areas that align with four PSEL standards and the CR-SE framework, with the exception of supporting specific student groups (which is critical for promoting a community of care and a welcoming and affirming environment).
| PSEL Standards | New York State Principles of Culturally Responsive and Sustaining Education | Survey Items | Mean Rating |
|---|---|---|---|
| Equity and cultural responsiveness (3) | Welcoming and affirming environment | Strive for equity | 4.9 |
| Equity and cultural responsiveness (3) | Inclusive curriculum and assessment | Integrate DEI throughout | 4.5 |
| Curriculum, instruction and assessment | High expectations and rigorous instruction | Develop coherent systems of curriculum and instruction | 4.9 |
| Community of care for students (5) | Welcoming and affirming environment | Support students | 3.0-4.0 |
| Professional capacity of school personnel (6) | On-going professional learning | Develop professional capacity of staff | 4.8 |
Recruitment Practices
As part of our investigation, we asked program directors to identify how they recruited students, particularly for diversity. The majority of program directors (60%) reported that they recruited diverse students by targeting local school districts. At least one institution diversifies its program's students by recruiting locally. As the program director explained, "given where [our institution] is situated, recruitment efforts are concentrated in the Bronx, and we typically attract Black, Latinx, and AAPI students, many of whom grew up in and work in the Bronx, along with a few white students."
Other recruitment strategies appeared to be more generic and not necessarily targeted at diverse students, including university recruitment events (50%) and social media outreach (48%). Some institutions had targeted strategies like recruiting students via professional organizations (30%), such as the Long Island Latino Teachers Association or the Long Island Black Educators Association, or offering targeted scholarships to students from diverse backgrounds (15%). As one program director shared, "We have a scholarship for emerging leaders of color that we give out once a year to all students of color in our program."
Diversity of the Aspiring Leader Pool
From our survey, we learned about the diversity of leadership preparation students served in 2023-24. On average, 60% of the institutions' leadership preparation students are white, 19% are African American, 14% are Hispanic, 2% are Asian-American, and 3% are other. In addition, 72% are female and 43% are from urban locations (see Table 6). These percentages were fairly comparable for public and private institutions (see Table 7).
These average percentages vary widely by region, with NYC and the Lower Hudson Valley having the lowest average percentage of students who were White, and Western New York having the highest. Almost 79% of the students in NYC programs are female, in contrast to 65-71% in the other regions. Almost all the students in NYC programs (88%) are urban, in contrast to 17-18% for institutions Upstate and on Long Island.
Relationship Analysis
We had wondered whether there were any institutional, program or student characteristics that were related to a programmatic emphasis of DEI content and instruction in the institutions' programs. We found, however, that there was no statistically significant relationship between DEI-related program attributes and student demographics or program measures of tuition rates and number of credits.
Discussion
The Landscape of Educational Leadership Programs in New York State
Our analysis of leadership preparation programs reveals several important trends. First, the overall number of programs has declined, largely due to institutional and program closures at private universities, with most occurring in the New York City metropolitan area. Still, the majority of programs statewide remain concentrated in that region.
Graduation patterns also vary by geography. Long Island programs produce the largest number of graduates with post-graduate certificates or master's degrees in educational leadership, while Upstate and Western New York produce the fewest. This raises potential access issues for aspiring leaders outside the metropolitan area, though the growing use of online modalities may mitigate geographic barriers.
The modality of the program, tuition, and faculty type mattered. Programs with higher tuition and greater reliance on adjunct faculty graduated more students on average. This is puzzling as it appears as though more expensive programs are serving larger numbers of graduates. This pattern suggests that large cohorts of future leaders may be educated primarily by adjunct instructors. Notably, there are reduced opportunities across the state for in-person learning experiences for aspiring leaders as institutions embrace online learning modalities.
Credit requirements also differed somewhat across regions and sectors. Long Island programs require the fewest credits while producing the most graduates. Public institutions typically require more credits than private ones, which appears to offset higher tuition costs by reducing credit requirements.
Taken together, the landscape of principal preparation in New York appears to be defined by online delivery, streamlined credit requirements, and an adjunct-heavy instructional model. While regional differences remain, the broader pattern raises important questions about quality, access, and sustainability. Program competition may be driving program design and delivery, toward lower credit requirements and greater reliance on adjunct faculty. Monitoring program growth and closures in the coming decade will be essential as well as setting expectations for program quality, particularly as state certification requirements continue to evolve.
The Landscape of Diversity, Equity, and Inclusion Preparation Practices in New York State
Our analysis of leadership preparation programs across New York State reveals both encouraging practices and notable disparities in how programs address diversity, equity, and inclusion. A central finding is that just under one-third of programs (32%) require a dedicated DEI or social justice course. However, this average conceals regional differences. Programs in Central, Western, and Upstate New York were more likely than others to require such coursework, with over half reporting a dedicated DEI course. In contrast, not a single program on Long Island offered this requirement. The Lower Hudson Valley and New York City programs fell in between, with approximately one-third to one-half reporting a course dedicated to DEI. Sectoral differences were also evident. Private institutions were more likely than public ones to require a dedicated DEI course (39% compared to 25%).
Most institutions' programs, regardless of having a dedicated course, integrate social justice explicitly throughout all coursework and internship experience. The regional differences suggest that, although most programs strive to address DEI, the extent of coverage is uneven. Importantly, program directors reported their strongest emphasis on broad principles—striving for equity, developing professional capacity, and cultivating cultural competence. In these areas, program ratings were consistently high, with nearly all directors reporting moderate to extensive integration of equity principles across coursework.
At the same time, findings reveal persistent gaps when considering developing leadership to support specific student populations. While programs rated themselves highly in preparing leaders to support students with disabilities, average scores dropped when considering English Language Learners and LGBTQ+ students, and fell even further for Indigenous students. This discrepancy highlights a tension between a strong general commitment to equity and a lack of depth in preparing leaders for the diverse realities of particular student groups.
Instructional practices also varied widely across programs. The majority used DEI-focused case studies and texts, and about half incorporated identity development courses. Fewer programs reported experiential or community-based practices such as equity audits, simulations, community walks, or thesis projects focused on equity. Some directors, however, described innovative practices, such as simulations with trained actors or participation in campus-based racial healing initiatives. These practices suggest that while experiential approaches are not universal, they may provide powerful models for engaging students in active, practice-based learning about DEI.
Recruitment efforts further demonstrate the ways in which institutional context shapes DEI commitments. Most programs recruited primarily from local school districts, with some drawing on professional associations or offering targeted scholarships for aspiring leaders of color. Private institutions appeared somewhat more proactive in these targeted efforts. Student demographics varied significantly by region: while New York City and the Lower Hudson Valley reported lower proportions of White students and higher proportions of students of color, programs in Western New York reported the highest percentages of White enrollment. Female students represented a large majority overall with their concentration especially high in New York City programs.
Taken together, these findings point to a system that has made substantial progress in weaving DEI principles into leadership preparation but still demonstrates unevenness across regions, sectors, and student groups. Programs have aligned their curricula with Professional Standards for Educational Leaders (PSEL) and New York's Framework for Culturally Responsive and Sustaining Education, particularly around equity, professional capacity, and continuous improvement. However, the weaker ratings for supporting English Language Learners, Indigenous students, and LGBTQ+ students highlight areas where programs fall short of the state's own standards for building welcoming and affirming environments.
Ultimately, these findings underscore both the promise and the challenge of preparing equity-focused school leaders in New York. Programs have broadly embraced the need for DEI integration, but differences remain by region and by institutional sector.
Implications and Recommendations
This report was prepared at the same time as the state was revamping its certification requirements, leading to changes in leadership preparation program registration requirements. While the findings shared here provide useful implications for program policy and state policy, a follow-up study of programs would be warranted to learn about the program delivery impact of the recent licensure changes.
State Policy Recommendations
Program Quality Standards
With the state licensure requirements to combine building and district leadership preparation, program quality becomes even more paramount. While the state requires alignment to national leadership standards, we question whether quality preparation can be fostered and sustained in fully asynchronous programs, where students never meet. We are also concerned that programs with fewer than 30 credit requirements may be unable to prepare candidates effectively to meet these standards for both building and district leadership roles. Similarly, we question whether a fully adjunct staffed program can sufficiently develop and sustain a coherent, high-quality program that can recruit diverse candidates for admissions, monitor program outcomes, stay current with research and field priorities, and coordinate and integrate program components, student feedback and field relations.
Recommendation: The state should set expectations for program quality in support of the national standards and establish parameters for program delivery, particularly the number of credits, adjunct/faculty ratios, and asynchronous/synchronous and face-to-face contact time ratios.
Accreditation Standards
Recommendation: The state should work with national accreditation agencies (such as AAQEP and CAEP) to establish recommended adjunct/faculty ratios, as exists for other professions, such as counseling.
Program Moratorium
To reduce competition and its unintended effects on program quality and to stabilize the field, we recommend that the state establish a moratorium on approving new educational leadership preparation programs.
DEI and CR-SE Framework Requirements
Given the state's strong stance on diversity, equity and inclusion and the CR-SE framework for schools and districts, we expected a stronger emphasis on DEI-related leadership preparation than we found in our survey results.
Recommendation: The state should add a program requirement to demonstrate how they are preparing leaders to implement the CR-SE framework and assess candidates' DEI proficiency in coursework and field work.
Diversity Funding
To improve the diversity of candidates in the leadership pipeline, we recommend that the state provide scholarships and other funding opportunities to support candidates and programs in their diversity efforts.
Program Policy Recommendations
From our analysis of program structure—based on credits, modality, staffing, and tuition costs—it appears that programs are struggling to balance these to maintain competitive enrollments. We are concerned that this is yielding shortened preparation, high adjunct/faculty ratios, and no in-person student contact.
With the new state licensure policy, programs must now expand the scope of their preparation to encompass preparation for both building and district leadership readiness. Such necessity competes with these structural considerations and may lead to higher adjunct/faculty ratios and more asynchronous coursework. The added competition for students, particularly in the greater NYC area, may drive institutions to reduce credit requirements, resulting in a superficial coverage of the new state requirements, yielding more poorly prepared leaders.
Program Modality Evaluation
Recommendation: Programs should rethink their asynchronous/synchronous and face-to-face balance and evaluate the impact of fully asynchronous programs on measures of candidate readiness, such as through the NYS leadership exams and candidates' post program career advancement.
Academic Integrity
We are concerned, in particular, with the expanded use of generative AI tools such as ChatGPT, that students may not be producing authentic work products. While not addressed in our survey, we are concerned about the potential abuse, particularly for students in asynchronous-only programs.
Recommendation: Programs should examine how to increase face-to-face interactions and assessments to curb potential abuse and improve the quality of preparation.
Professional Standards
We also recommend that the challenges outlined here should become a policy priority for programs to collectively address by establishing their own professional standards for adherence to PSEL standards, program length, use of asynchronous modality, and adjunct-to-faculty ratios.
DEI Curriculum Audit
While our review of DEI-related program content was limited, it suggests that programs have a foundation but should be providing more in-depth DEI content and active learning activities (beyond the discussion of case studies).
Recommendation: Programs should begin with a curriculum audit of their programs on how DEI-related leadership knowledge, skills, and dispositions are fostered within dedicated courses (if required) and across all courses (if blended) and their internship.
Diversity Recruitment
Recruiting diverse candidates remains a challenge for programs outside the greater NYC area, particularly in balancing the competition for students generally.
Recommendation: All programs should evaluate their diversity yield against their recruitment strategies and consider expanding their partnerships and relationships with professional organizations.
Research Recommendations
Our findings yield several research recommendations that we encourage state support:
- Establish a bi-annual survey of programs, examining program features, structures and modalities, as well as implementation of new policy requirements and relevant issues.
- Share state-level data that would enable longitudinal evaluation of program features, structures, and outcomes, based on NYS leadership assessment scores and graduates' careers, possibly evaluating the TEACH data system, as a longitudinal 10-year study.
- Launch an in-depth study of the new combined internship for its attributes, development of DEI-related leadership, and other PSEL competencies, for both school and district level leadership.
References and Appendices
References
- Baum, S. and Steele, P. (2018). The price of graduate and professional school: How much students pay. Access Lex-Funded Research. 12
- National Policy Board for Educational Administration. (2015). Professional standards for educational leaders 2015. Retrieved August 16, 2025, from https://www.wallacefoundation.org/sites/default/files/2023-09/Professional-Standards-for-Educational-Leaders-2015.pdf
- New York State Education Department. (n.d.). Culturally responsive-sustaining education framework. Retrieved August 16, 2025, from https://www.nysed.gov/crs/framework
- Radd, S. I., Generett, G. G., Gooden, M. A., & Theoharis, G. (2021). Five practices for equity‑focused school leadership. ASCD
- Fuller, E. J., & Young, M. D. (2022). Challenges and Opportunities in Diversifying the Leadership Pipeline: Flow, Leaks and Interventions [Article]. Leadership & Policy in Schools, 21(1), 19-34. https://doi.org/10.1080/15700763.2021.2022712
- Koonce, G. (2009). Accreditation: A Standards-Based Model for Aligning Learning Outcomes in a Master's Degree Educational Leadership Preparation Program. International journal of educational leadership preparation, 4(3), 2009. https://research.ebsco.com/linkprocessor/plink?id=2492d7ff-b077-3b7f-9b57-65c7d1289438
- Pavlakis, A., & Kelley, C. (2016). Accreditation in the Professions: Implications for Educational Leadership Preparation Programs. Journal of research on leadership education, 11(1), 68-90. https://doi.org/10.1177/1942775116641663
- Perrone, F., & Tucker, P. D. (2019). Shifting Profile of Leadership Preparation Programs in the 21st Century. Educational administration quarterly, 55(2), 253-295.
- Reyes-Guerra, D., Barakat, M., & Maslin-Ostrowski, P. (2022). Developing a More Diversified School Leadership Pipeline: Recruitment, Selection and Admission through an Innovative University-District Partnership. Leadership and policy in schools, 21(1), 48-63.
- Scott, D. (2018). 50-State Comparison: School leader certification and preparation programs.
- Steele, J. L., Steiner, E. D., & Hamilton, L. S. (2021). Priming the Leadership Pipeline: School Performance and Climate under an Urban School Leadership Residency Program. Educational administration quarterly, 57(2), 221-256.
Appendix A: Active Educational Leadership Programs in New York State
In total, 37 programs were identified via the website data. There are 35 programs identified in the survey data; two programs did not provide information.
For a complete, searchable directory of these programs with contact information, please
visit:
New York State Educational Leadership Program Directory
Central NY (4 programs)
- Le Moyne College
- SUNY Cortland
- SUNY Oswego
- Syracuse University
Long Island (6 programs)
- Adelphi University
- Hofstra University
- Long Island University Post
- Molloy University
- St. Joseph's University
- SUNY Stony Brook
Lower Hudson Valley (3 programs)
- Manhattanville University
- SUNY New Paltz
- Mercy University
New York City (11 programs)
- Bank Street College of Education
- Teachers College, Columbia University
- CUNY Brooklyn College
- CUNY City College
- CUNY College of Staten Island
- CUNY Hunter College
- CUNY Lehman College
- CUNY Queens College
- Fordham University
- St. John's University
- Touro University
Upstate New York (4 programs)
- Russell Sage College
- SUNY Albany
- SUNY Plattsburgh
- SUNY Potsdam
Western New York (9 programs)
- Buffalo State University
- Canisius College
- Niagara University
- St Bonaventure University
- St. John Fisher University
- SUNY Binghamton
- SUNY Brockport
- SUNY Buffalo
- SUNY Fredonia
Appendix B: IPEDS Graduate Data by Institution
The following table shows the number of graduates from New York State Leadership Preparation Programs by institution, type of certificate or degree, for the 2023-2024 academic year, as reported through the Integrated Postsecondary Education Data System (IPEDS).
| Institution | IPEDS Category | Post-graduate Certificate | Master's Degree |
|---|---|---|---|
| Adelphi University | Educational Leadership and Administration, General/Educational, Instructional, and Curriculum Supervision (distance) | 8 | 0 |
| Bank Street College of Education | Educational Leadership and Administration, General. Instructional, and Curriculum Supervision | 6 | 124 |
| Binghamton | Educational Leadership and Administration, General | 18 | 0 |
| Brooklyn College | Educational Leadership and Administration, General | 0 | 30 |
| Canisius College | Educational Administration and Supervision, Other/ Educational, Instructional, and Curriculum Supervision | 10 | 6 |
| City College | Educational Leadership and Administration, General | 17 | 4 |
| Fordham University | Educational Leadership and Administration, General | 5 | 22 |
| Hofstra University | Educational Leadership and Administration, General | 14 | 1 |
| Hunter College | Superintendency and Educational System Administration | — | — |
| Lehman College | Educational Leadership and Administration, General | 10 | 15 |
| LeMoyne College | Educational Leadership and Administration, General | 25 | 25 |
| Long Island University Post | Educational Leadership and Administration, General (all programs marked as distance) | 77 | 39 |
| Manhattanville University | Educational Leadership and Administration, General/Educational, Instructional, and Curriculum Supervision | 16 | 3 |
| Mercy University | Educational Administration and Supervision, Other/Educational, Instructional, and Curriculum Supervision | 0 | 19 |
| Molloy University | Educational Leadership and Administration, General | 93 | 0 |
| Niagara University | Educational Administration and Supervision, Other | 5 | 25 |
| Queens College | Educational Leadership and Administration, General | 1 | 16 |
| Russell Sage College | — | 0 | 0 |
| St Bonaventure University | Educational Leadership and Administration, General | 14 | 2 |
| St. John Fisher University | Educational Leadership and Administration, General | 0 | 7 |
| St. John's University | Educational, Instructional, and Curriculum Supervision | 22 | 16 |
| St. Joseph's University (registered in BK) | Educational Leadership and Administration, General | 2 | 2 |
| Stony Brook | Educational Leadership and Administration, General | 165 | 0 |
| SUNY at New Paltz | Elementary and Middle School Administration/Principalship | 57 | 0 |
| SUNY Brockport | Educational Leadership and Administration, General | 0 | 4 |
| SUNY Cortland | Educational Leadership and Administration, General | 32 | 0 |
| SUNY Fredonia | Educational Administration and Supervision, Other | 13 | 0 |
| SUNY Oswego | Educational Leadership and Administration, General | 45 | 0 |
| SUNY Plattsburgh | Elementary and Middle School Administration/Principalship/ Educational, Instructional and Curriculum Supervision | 25 | 0 |
| SUNY Potsdam | Educational Leadership and Administration, General | 14 | 0 |
| Syracuse University | Educational Leadership and Administration, General | 24 | 0 |
| The College of Staten Island | Educational Leadership and Administration, General | 15 | 0 |
| Touro University | Educational Leadership and Administration, General | 0 | 43 |
| University at Albany | Educational Leadership and Administration, General | 0 | 6 |
| University at Buffalo | Educational Leadership and Administration, General | 0 | 5 |
| Teachers College, Columbia University | Educational Leadership and Administration, General | 0 | 139 |
| Buffalo State University | Educational Leadership and Administration, General | 11 | 0 |